The Canary Killed the Coal Mine
I’ve been working on getting an observability stack going on the cluster, and came across one of those situations where the thing looked broken, but actually it was working perfectly as intended. In early stages here, my plan was to monitor the syslogs on my Ubiquiti setup.
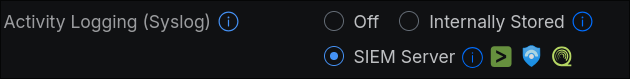
There’s a handy little section for offloading syslogs in the UI:
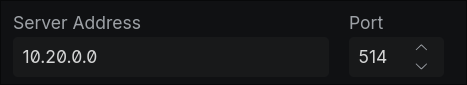 Wouldn’t it be fun if that was all it took? That 10.20.0.0 address, conveniently supplied by Cilium, is the loadbalancer IP for Alloy.
The plan was to set up Alloy to receive the logs from the UDM Pro, forward them to Loki, where I can visualize them with Grafana.
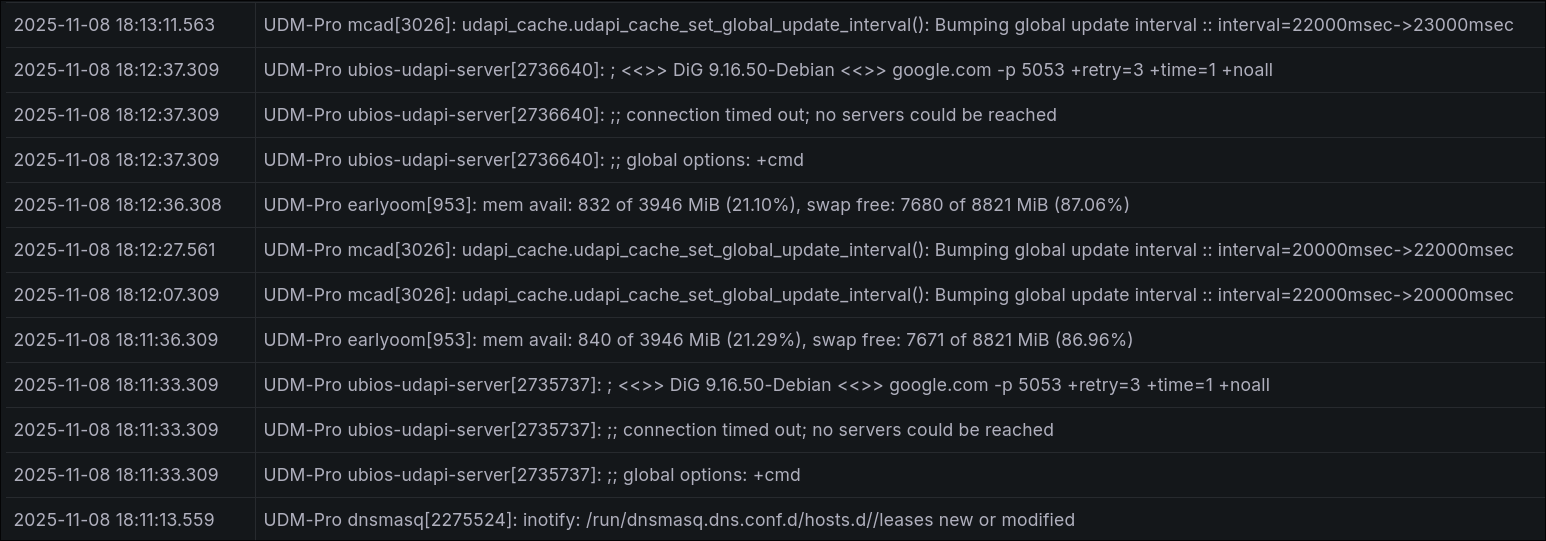
Having never touched any of this before (aside from a whirlwind of a migration of a Splunk instance at work), I had no idea where to look to see if anything was happening at all. Eventually, I found the Explore section in Grafana hoping to see some raw logs, where I saw:
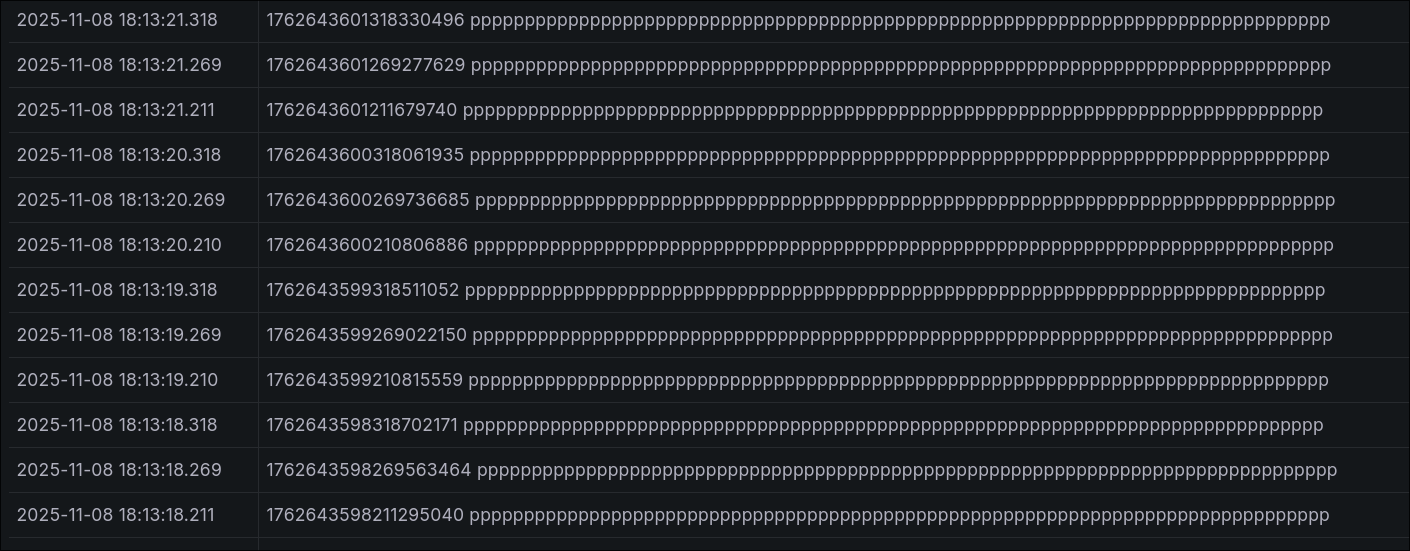
Which I guess was something, but looked like a case of unrecognized formatting. I lost a day until I figured out that the source was from a daemonset called Loki Canary. Upon looking up what the heck that was, I found this:
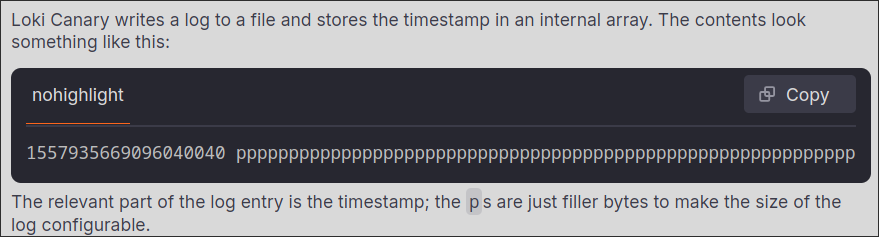
Apparently the entries full of ppppppppppppppppppppppppppp were pretty much a heartbeat from each Canary pod in the cluster. If those were to ever stop, you’d know something was wrong.
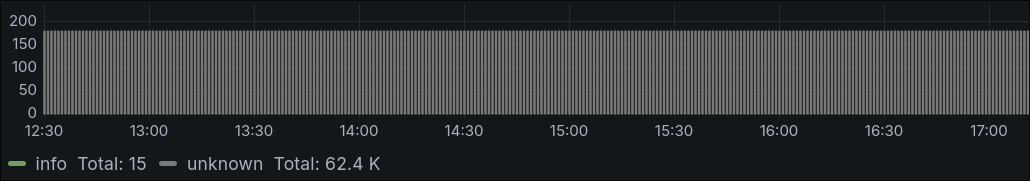
However, it was completely flooding out my raw (for now) logs at tens of thousands of entries a day.
After adding the below to my values.yaml:
# no more pppppppppppppppppppppppppppppp
lokiCanary:
  enabled: false
Everything started looking a lot more normal: