Bandwidth Visualizer
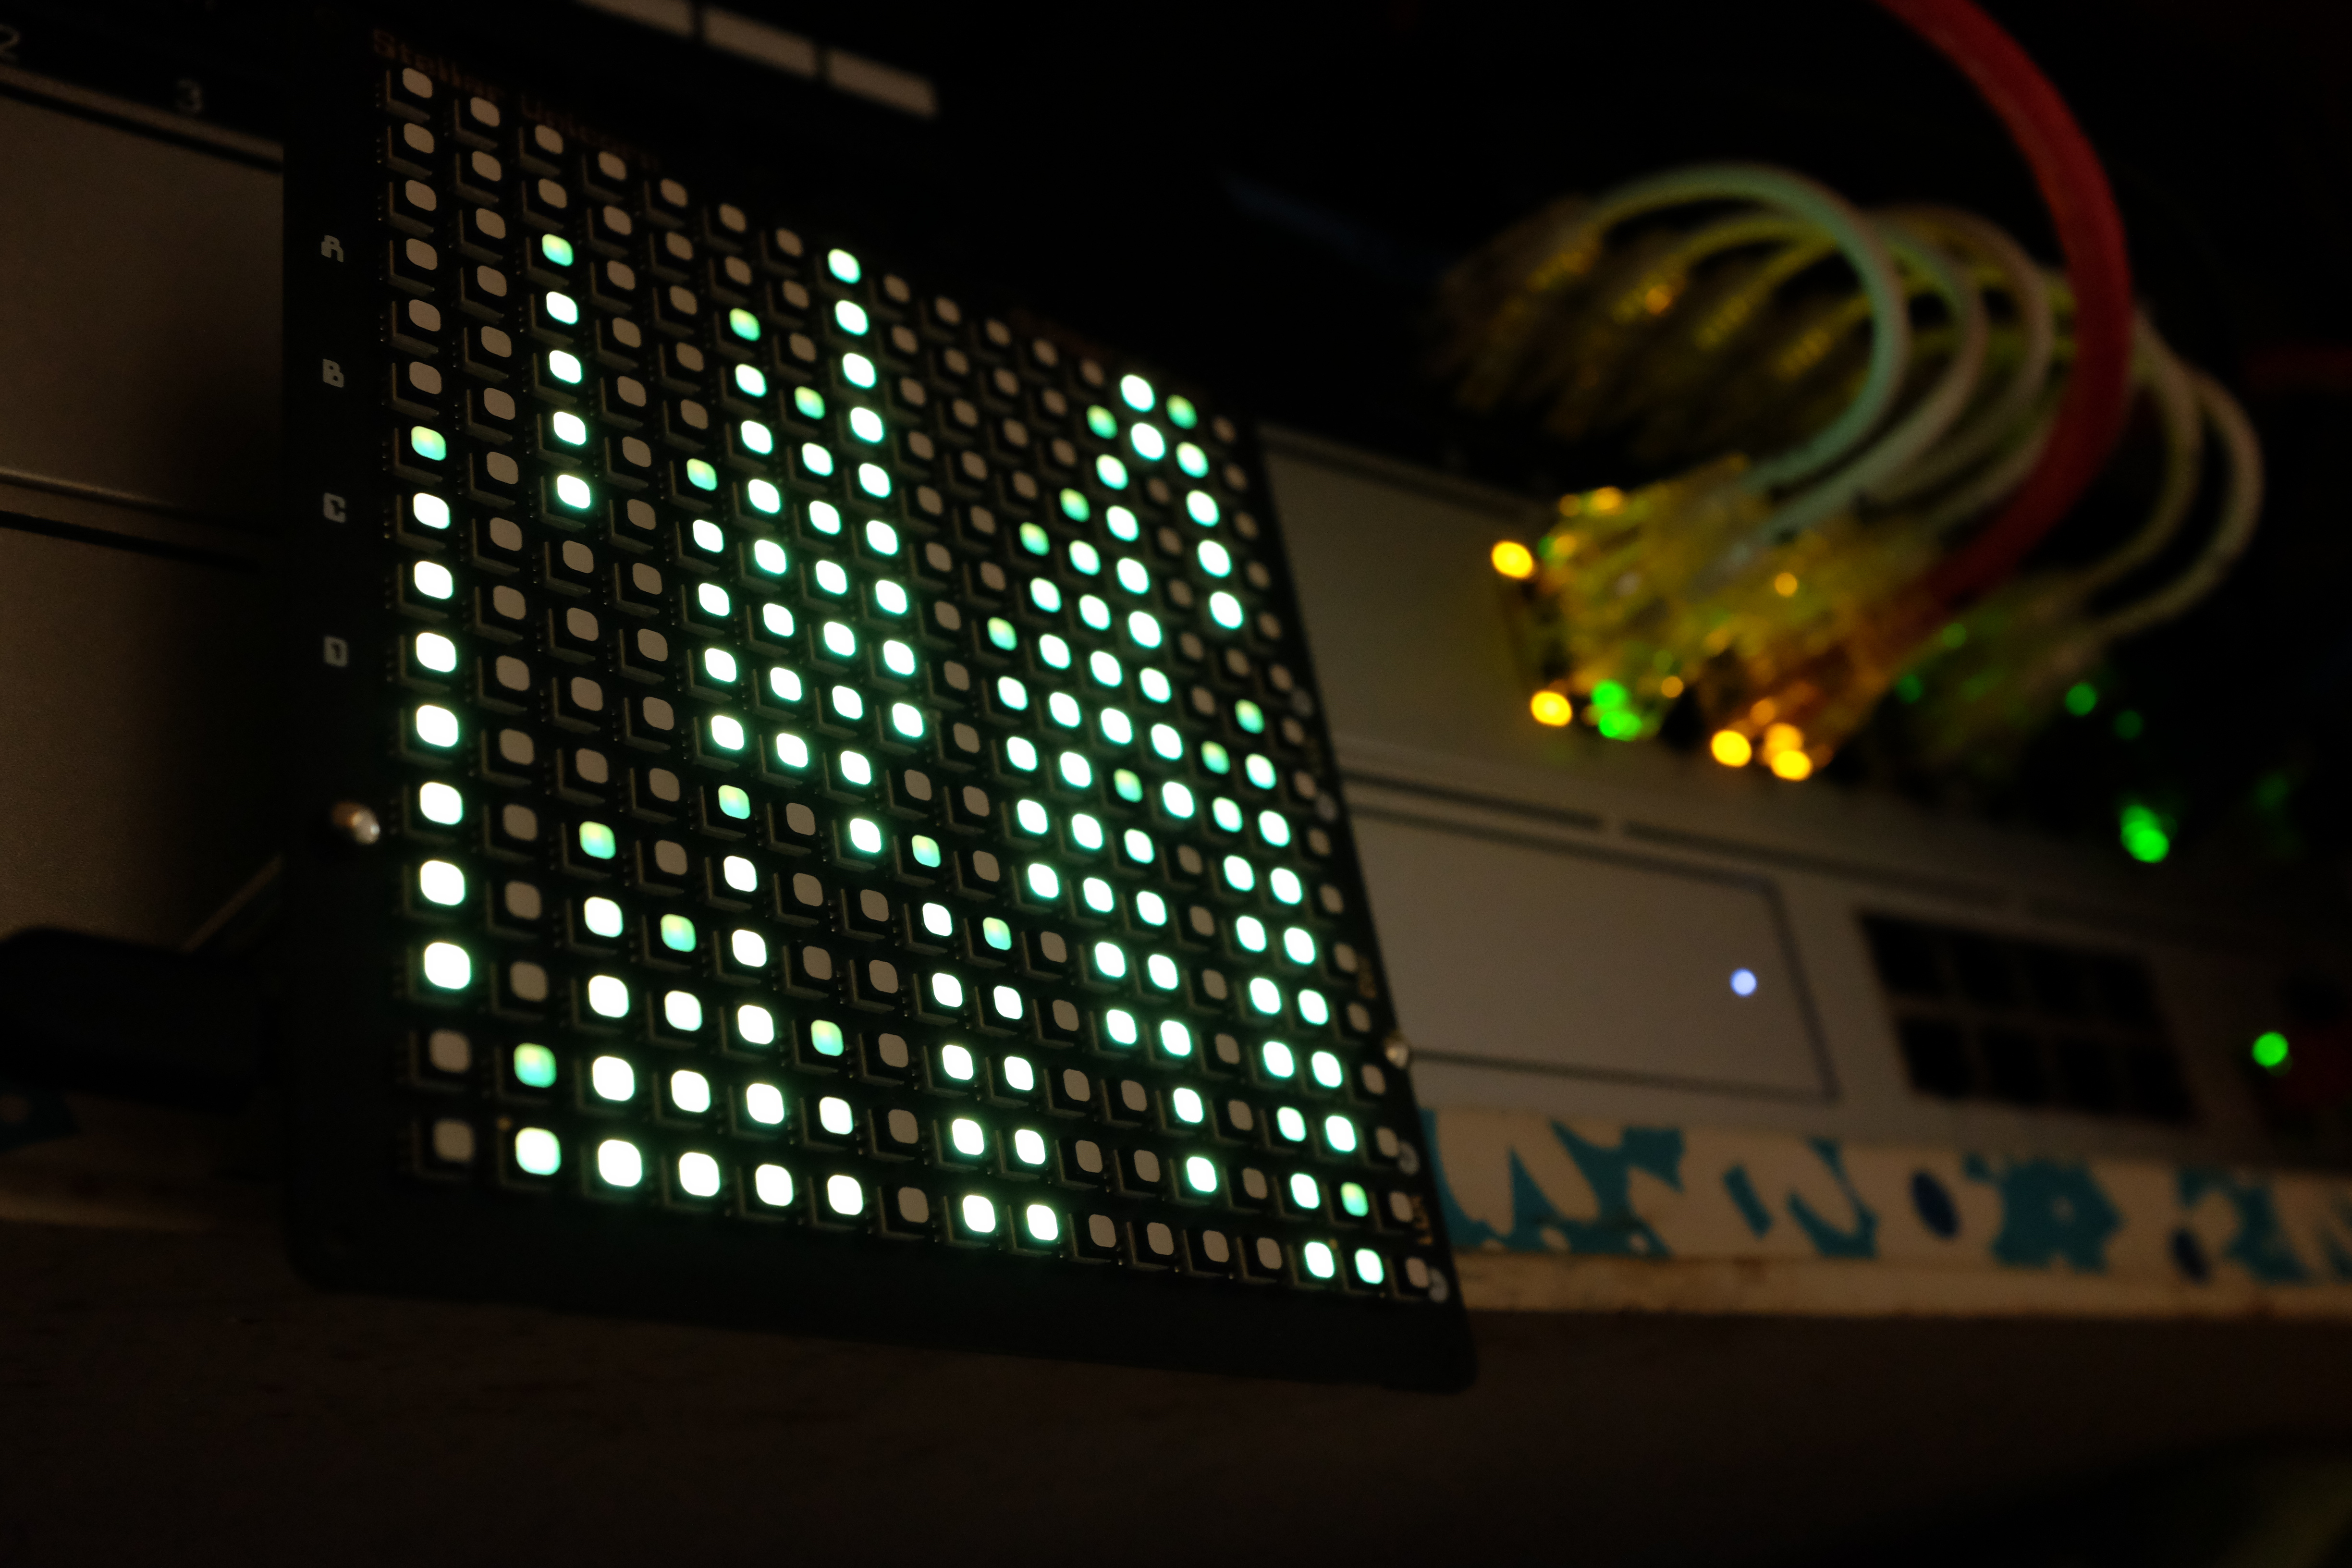
A while back I came across this Stellar Unicorn in the clearance bin at Micro Center for $15 and picked it up. It’s basically a 16x16 RGB LED display with a Raspberry Pi Pico W stuck to the back of it. It comes with a few neat example graphics scripts, but the real purpose is for you to write your own. It was only now that I figured it was time to sit down and learn how to.

My plan was to create a network bandwidth visualizer fashioned after the title sequence to The Matrix. My network at home is Ubiquiti-based, with a Unifi Dream Machine at the core, which is nice in many ways but also provides API access via the Ubiquiti API.
This project has been a mix of a lot of things I’d been meaning to get into or put to use but just never had the right excuse:
- Network visibility and programmability
- Asynchronous programming in Python
- Embedded systems
The Python side of things is MicroPython, a stripped down and streamlined version of Python made for microcontroller boards such as this RPi Pico W. When you flash the MicroPython firmware to the board, it creates a little filesystem for you to upload your scripts, and at power-on, it finds and runs main.py. It’s also got its own version of pip, mip (which came in handy for installing uasyncio and ujson).
Inside, I have three loops running asynchronously (in parallel):
- Poll the API at regular intervals and update the downstream utilization on the uplink in bytes per second.
- Spawn the dots at the top of the screen according to an interval based on the uplink utilization.
- Update the positions of the dots as they scroll down the screen, clearing out the ones that reach the bottom, and then update the display according to the configured frames per second variable (currently set to 4 FPS, which is slow but I’ll explain).
I had originally had these running synchronously, which was a tremendous pain because I had to:
- Track when each variable was last updated
- Track how long it’s been since the last update
- Actually update the variable
- Update the last update time.
Even with just a handful of variables, it took a lot of time that I should have just spent learning async io.
The remaining problem is, when the API call is made, the whole device freezes for a fraction of a second, in spite of being run asynchronously. It doesn’t sound like much, but it manifests as a very annoying stutter that is more noticeable at higher FPSes. Even at 4 FPS it is still there and that’s as good as I can get it.
There are also four buttons on the back of the display, and I’ve been wondering about what kinds of things I could do with them with the API. Turn the ad blocker on and off? Cut my kid’s internet access when necessary? Maybe initiate a graceful shutdown in case of a power outage.
In any case, I’m hoping to make a library of these visualizations because I spend my day at work looking at line graphs, but it’s nice to see network activity in a more tangible way, even if it’s completely qualitative and not exactly representative of reality (I fudged with multipliers a lot to get it to “look right”).
Oh, and another great thing about this – it’s got wifi, so I can just put this anywhere in the house, give it 5VDC and it automatically connects and starts doing its thing.